The Excel Analyst’s Guide to Python: The Art of the Great Clean-Up
How to stop fixing typos by hand and start cleaning data like a pro.

The Monday Morning Struggle
We have all been there. It is Monday morning, the coffee hasn't kicked in yet, and you see an email notification that makes your stomach drop. It’s from Corben, our favorite Sales Coordinator. Poor Corben. He is a wizard with people, but he is currently staring at his screen in despair. He just received the "Weekly Regional Sales Dump" from two different territory managers. "It’s a mess," Corben sighs, pointing at the spreadsheet. "Look at this. The East Coast team writes dates as '20240101'. The West Coast team spells 'Henry' as 'Henri' half the time. And for some reason, the 'Value' column is stored as text because someone put a space in the empty cells."
He opens his usual toolkit:
CTRL + H to Find and Replace.
=TRIM() to remove spaces.
=PROPER() to fix the names.
Text-to-Columns to fix the dates.
He has to do this every single week. It takes him two hours of manual clicking, dragging formulas, and pasting as values. One slip of the mouse, and he has to start over. "I spend 90% of my time cleaning the data and only 10% actually analyzing it", he says.
If you are an Excel Analyst, you know Corben’s pain. You live it.
But there is a better way. In Python, we don't "fix" data by hand. We create a recipe: a script that takes the messy ingredients and cooks them into a perfect dataset, instantly. Today, we are going to walk through a real-world data cleaning scenario. We will take a messy dataset (just like Corben’s) and clean it using Python’s "Pandas" library. And the best part? We are going to do it in Excel.
The Setup: Our Messy Dataset
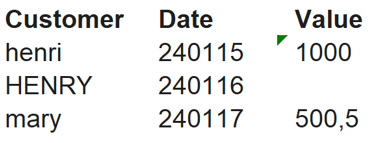
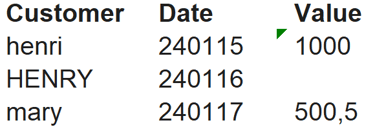
To make this concrete, let's look at the exact data Corben is dealing with. It’s a small sample, but it represents the chaos of real-world reporting. We have three columns: Customer, Date, and Value.
The Problems:
Customer: inconsistent casing ("henri" vs "HENRY"), leading/trailing spaces, and typos.
Date: stored as a weird text format (YYMMDD) that Excel doesn't recognize as a date.
Value: stored as text, and contains blank values that break math formulas.
Let's switch on Python and see how we fix this in seconds.
Part I: The Diagnosis (Know Your Enemy)
Before you start cleaning, you need to know how bad the damage is. In Excel, you might scroll through the sheet or look at the status bar. In Python, we have two commands that give us an instant X-Ray of the data.
df.info()
What it is
This command prints a concise summary of your DataFrame (your table). It tells you how many rows you have, the name of each column, and—most importantly—the data type of each column.
The Excel Analogy
This is like trying to sum a column and getting 0 because the numbers are actually "Text". You select the column and look at the "Number Format" dropdown in the Home ribbon to check if it says "General", "Text", or "Date".
In Action
What Corben sees
He notices that the Value column has a data type of object (which means Text in Pandas). This confirms his suspicion: he can't sum these numbers yet.
df.describe()
What it is
This generates descriptive statistics. For number columns, it gives you the mean, min, max, and count. For text columns, it tells you the most frequent entry and how many unique values exist.
The Excel Analogy
This is like highlighting a column and looking at the bottom status bar for "Average: 120, Count: 50". Or using the "Data Analysis Toolpak" to run descriptive stats.
In Action
What Corben sees
Corben runs this and sees that the Customer column has 3 unique values for what should be 2 people (Henry and Mary). Why? Because "henri" and "HENRY" are being counted as different customers. Time to clean.
Part II: The Customer Column (Text Cleaning)
Text data is notoriously dirty. Humans make typos. Systems add spaces. If you want to group your sales by customer, "henri" and "HENRY" need to be the same person.
Step 1: Fix the Typo (Find and Replace)
The Definition
We need to identify a specific string of text ("henri") and replace it with the correct version ("Henry").
The Excel Analogy
CTRL + F (Find) > CTRL + H (Replace). You type "henri" in the 'Find what' box and "Henry" in the 'Replace with' box.
The Python Way
Note: We are telling Python: "Take the Customer column, replace the value, and save it back into the Customer column."
Step 2: Capitalize Each Word
The Definition
We want to standardize the casing so that the first letter is uppercase and the rest are lowercase (Title Case).
The Excel Analogy
The =PROPER(A2) formula. You would usually create a new helper column, write the formula, drag it down, and then copy-paste as values over the original.
The Python Way
Note: We access the .str accessor, which gives us access to string methods. .title() does exactly what PROPER does, but for the entire column at once.
Step 3: Trim the Fat (Removing Spaces)
The Definition
Removing invisible whitespace from the beginning and end of the text. " Mary " should become "Mary". These spaces are dangerous because they ruin VLOOKUPs.
The Excel Analogy
The =TRIM(A2) formula. Again, this usually requires a helper column in Excel.
The Python Way
Part III: The Date Column (The Time Traveler)
Dates are the arch-nemesis of every analyst. In our dataset, the date is stored as text: "240115" (YYMMDD). If you try to sort this chronologically in Excel, it might work by accident, but you can't calculate "Days since last purchase."
The Fix: Convert to Datetime
The Definition
We need to parse a string of characters and tell the computer how to interpret the Year, Month, and Day so it becomes a true Date object.
The Excel Analogy
Highlighting the column > Data Tab > Text to Columns > Next > Next > Selecting "Date: YMD" in the column data format.
The Python Way
Pandas has a super-function called to_datetime.
Why this matters
By specifying format="%y%m%d", we teach Python that "24" is the Year (%y), "01" is the Month (%m), and "15" is the Day (%d). Now, Corben can easily extract the month, calculating the difference between dates, or filter for "Q1" without complex text formulas.
Part IV: The Value Column (Numbers Only)
Finally, the Value column. It’s supposed to be money, but right now it’s text. We also have a blank cell where a value is missing.
Step 1: Fill the Blanks
The Definition
Handling missing data (Nulls/NaNs). You cannot do math on a blank. You need to make a decision: do we delete the row? Or do we assume it’s zero? In this sales context, a blank likely means no sale, so we assume 0.
The Excel Analogy
Select Column > F5 (Go To) > Special > Blanks. Then type "0" and hit CTRL + Enter to fill all selected cells.
The Python Way
Note: fillna(0) is self-explanatory. It finds the "NaNs" (Not a Number) and fills them.
Step 2: Force to Integer
The Definition
Changing the data type from Text (String) or Decimal (Float) to a whole number (Integer).
The Excel Analogy
Highlight cells > Right Click > Format Cells > Number > Decimal places: 0.
The Python Way
Why this matters
Now, the value "500,5" becomes 500 and "1000" becomes the number 1,000. The column is now ready for math.
Part V: The Great Clean-Up in Action
Ready to see how this looks in the real world? In this video, I take you through a live demonstration of these exact clean-up techniques. Watch how we swap hours of manual Excel clicks for a few seconds of automated Python power.
Conclusion: Clean Data Unlocks Insights
Let’s look at what we accomplished. We started with a dataset that was essentially unusable. We couldn't group by customer because of typos. We couldn't plot trends because the dates were text. We couldn't calculate revenue because the values were strings. With just 5 or 6 lines of simple Python code, we transformed it into a clean, analytical dataset.
For Corben, this is life-changing. He doesn't need to spend his Monday mornings manually finding and replacing typos. He saves this script, and next Monday, when the new "Data Dump" arrives, he just presses Run. Data cleaning isn't the glamorous part of analytics. It’s dry. It’s boring. But it is the foundation of everything else. You cannot build a dashboard on a swamp. By moving your cleaning process from Excel (manual) to Python (automated), you ensure accuracy, save time, and free yourself up to do the job you were actually hired to do: Finding Insights.
If you are tired of being a "Data Janitor" like Corben and want to build your own cleaning recipes, check out my course Python in Excel for Beginners: From Zero to Insight. It is designed specifically for Excel users—no complex loops, just practical solutions.